Obama’s Great Recession

Obama’s Great Recession
Our Chief-Story-Teller is claiming the US economy has improved since his inauguration. I wonder from which fortune cookie he pulled that nonsense. Then in June, he said: “the private sector is doing fine.” Sooner or later, OBama needs to hone in on the truth or get better at lying. Zen is not easy. It takes effort to attain nothingness.
Regardless of what Obama says, you will always have to unravel his fictional narrative. While he claims to have a “laser focus” on jobs, he also admits he sometimes forgets the impact of the recession. Todays walkaway: Regardless of his swag, the record show that the programs Obama has put in place have failed. Keynesianism doesn’t work, never has worked, and never will work.
For all of his talk about jobs and the economy, most of Obama’s economic and job ‘recovery’ speeches are not plans, but politics of the plan. Every speech is a Mickey Rooney and Judy Garland musical. Yet, all the while Obama is systematically authoring an economic collapse, which would lead to political turmoil and ultimately socialism. When things collapse… everyone starts at the bottom together.
And, Socialism isn’t just about redistributing wealth. It’s about redistributing poverty. When you promote an entitlement mindset with free market rhetoric, fools will buy-in. And, it will attract lots of buyers. Socialism, not capitalism, is greed. People who are non-producers want what the producers have without working for it. In Obama’s world, businesses exist only to pay taxes and fund unions, who then fund Democrats, who then fund unions and their social programs. Repeat and rinse.
Jobs are the No. 1 issue going into the 2012 election, which makes the unemployment rate a particularly important indicator. Employment is a key economic indicator. But a return to economic growth is a PRECONDITION for growth in employment. And, the more we divert away from the real focus, the greater chance the GOP has of losing the election. But, knowledge is king. And just as they tell us when we first get on an airplane — we need to put our own oxygen mask on first before we help others.
A basic economics civil lesson…
Liberals believe power and income are derived from government, not the individual, ultimately believing justice, not law, is the means of their governance. There’s a clear cause and effect here that is a neat and predictable as a law of physics: As government expands, liberty contracts.
Every dollar government injects into the economy must first be taxed or borrowed ‘out of the economy’. No new spending power is created. It is merely redistributed from one group of people to another. It is intuitive that government spending financed by taxes merely redistributes existing dollars. In that sense, liberals think dipping water out of the deep end of the pool and dumping it into the shallow end of the pool will fill up the pool with more water.
But, government spending does NOT “pump new money into the economy” because government must first ‘tax or borrow’ that money out of the economy. Get it? So, once it becomes clear that government spending only redistributes existing demand, the case for “stimulus” spending collapses. All government stimulus spending requires first taxing or borrowing dollars that would have otherwise been applied elsewhere to the benefit of the economy. This Keynesian model is flawed.
History shows the U.S. economy has soared highest when the federal government was shrinking, and it has stagnated at times of government expansion. You can’t borrow your way out of a recession. You cannot spend your way out of debt. In fact, it is a mathematical impossibility to get out of a credit recession with more debt. And, just as rising inflation distorts economic behavior, tax policy too, influences human behavior.
Tax rate cuts raise tax revenues due to increased taxable activity. It happens every time it’s tried and is easily provable. Newton’s third law of motion even states that for every action there is an equal and opposite reaction. Therefore, if one object exerts a force on a second object, the second exerts an equal and oppositely directed force on the first one. Tax cuts raise tax revenues.
Democrats never figure into their calculations; the decrease in activity of an increased tax on that activity. After the Bush’s 2003 tax cut, the U.S. had 52 months of uninterrupted job growth. Boosting revenues requires expanding the economy so revenues generally correlate with economic growth, not tax rate increases. Tax cuts are great, but not if you don’t cut government spending.
Lower tax rates encourage working, saving, and investing, which in turn encourages job creation and wage growth. Even JFK understood that lower tax rates produce economic growth and even higher tax revenue. The current tax code punishes productive behavior and rewards unproductive behavior. And, the ‘tax the rich‘ class warfare canard Obama and the Democrats endlessly tout is numbing.
As bizarre as it might seem, its quite perverse to suggest that allowing someone to keep more of their own money, which in turn, stimulates people to take more risks by investing in businesses, would be a deterrent in stimulating economic growth. Money flows in circles: you get paid you spend it, and once spent, the store owner pays someone else, and that someone else spends elsewhere, and so on… It has a multiplier effect. So, how does Obama taxing John help Jane get a job?
Obama’s policies do nothing to increase capital investment, but instead, take from it. If banks don’t lend, small businesses can’t grow. If small businesses can’t grow, they cannot hire. If taxes go up, businesses cut cost. When businesses cut costs, workers are let go. When tax rates drop, tax revenue goes up. When businesses can hire, more employees are available to pay MORE in taxes.
This little off-Broadway production Obama and the Democrats have been performing is nearing its Final Act. Obama is America’s number One con artist and he will continue to cook the books on unemployment numbers and the economy right up to the election. But, Obama’s Recession is all on him. Just ask DNC Chair Debbie Wassermann Schultz…
The Scorecard…
- Facts and Stats to Fight a Lib: Obama’s Economy. His Economic record in ‘one chart.’
- Twenty-two (22) alarming facts about Obama’s economy. Apocalyptic.
- Seventy (70) facts Obama does not want you to see. Self Explanatory.
- Focused like a Laser Beam. Obama generated twice as many campaign contributors as new jobs through 2011.
- Under Obama: 30 Worst Months of Employment in the Past 25 Years. The 30 (or 32, including ties) worst months for employment in the past 25 years have all come after the most recent recession ended, in June 2009. In other words, they’ve all come during the Obama “recovery.” What’s more, under every other president during the past 25 years (spanning from the later stages of the Reagan presidency through the entire George W. Bush presidency), the employment-population ratio was always over 60% — every single month, for 260 consecutive months. With the exception of 2 months, Jan/Feb 2009, the employment-population ratio under Obama has always been under 60% — every single month, for 38 consecutive months. Obama’s ratio is 58.4%. And notably, over the past 25 years, the worst month under any other president has beaten the best month under Obama. This is an epic, pathetic failure.
- The smaller the Workforce. The smaller the Unemployment Number. If the size of the U.S. labor force as a share of the total population was the same as it was when Barack Obama took office — 65.7% then vs. 63.6% today — the U-3 unemployment rate would be 11.1%. If the same percentage of adults were in the workforce today, where it was when Bush took office, the unemployment rate would be 13.1%.
- ‘Real’ Unemployment Rate Remains 14.8%. Known formally as the U-6 unemployment rate, this measure includes those formally counted as unemployed, those known to be marginally attached to the workforce, and those working part-time because they cannot find full-time work.
- Obama and Crew are Playing Chicken with the Economy. A chart like this does not lie…
- People not in the Labor Force. Another chart that does not lie…
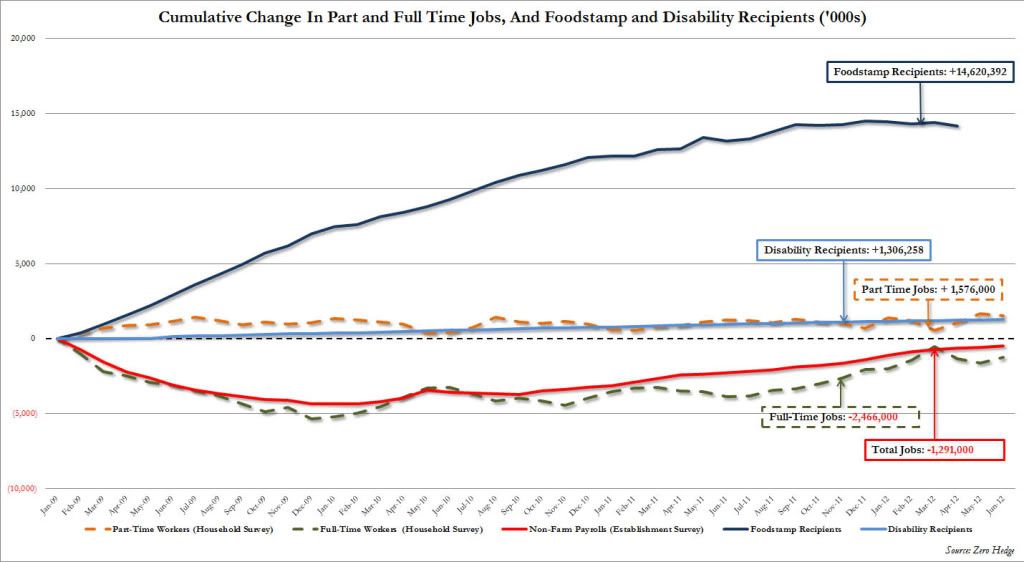
- Obama’s “jobs created” calculation. This amazing chart from Zero Hedge shows the cumulative change in Full and Part-time jobs, and Food-stamp and Disability Recipients. Obama does not differentiate between F/T and P/T. And, the BLS numbers don’t take into account a person working 2-3 part time jobs, because there is no cross-indexing. A such, in the BLS numbers, a person working three (3) jobs is invisible, and therefore not calculated or shown as “three workers”.
- Workforce Participation at 30-Year Low. The Obama manufactured decline in unemployment of 8.2% for May is due NOT to job growth but declining participation in the labor market.
- The 88 million invisible Unemployed. As of April, the BLS claims the number of people NOT in the labor force rose to 88.419 million. But, according to Business Insider, we have 100 million Americans out of the labor force. That is equivalent to absorbing the entire adult population of Canada and not a single person had a job. The Federal Reserve Bank of St. Louis also says that the Civilian Population – Employment Ratio is 58.4%. That’s the lowest labor force participation rate since 1981.
- Lies, Damned Lies and Government Jobs Data. In 60 out of the last 61 weeks, the weekly jobless numbers have been revised, after the fact, always in a higher direction. That’s unheard of.
- Obama’s long-term Unemployment Problem. When Obama was elected, the percentage of unemployed Americans that had been out of work for more than 52 weeks was less than 15%. Today, it is above 30%.
- In the past two years, 5.4 million workers have left the job market entirely. This, despite Obama’s latest assertion of having created 4 million jobs in the last 26 months.
- Under Obama, just 56% of College Graduates are able to Find Work. In 2006 and 2007, under Bush, 90% of all college graduates found a job.
- Obama Administration has Brought Hard Times to American Women. The chart. Under Obama, unemployment for black women alone has gone up from 10.2% to 13.3%.
- Fewer Numbers of Workers is what Drops Unemployment Rate, not Fewer Jobs. The chart… Look at the blue line. Any person with any common sense can see the trend is impossible. Unless people are dying, retiring or leaving the country in mass exit, that flatting of the chart starting in 2008 is an egregious outright lie. You can take the chart back to 1948 using the bls.gov website and see that what happened starting in 2008 is VERY unusual and has not happened in the recorded history of the BLS statistics [Bureau of Labor Statistics]. In fact, data that goes back during and before the GREAT DEPRESSION showed a steady increase in American workers… Enter Obama, master magician and conman extraordinaire. Now our workforce starts disappearing for the first time in our history!
- The Artificial 8%+ Unemployment Rate is Immaterial. Undeniably, raw data reveals a serial pattern of falsified government bookkeeping for the purpose of putting a positive face on the unprecedented disaster. The upside-down world of Obamanomics and BLS reporting, makes the jobless figure increasingly useless, hiding more than it reveals. According to Shadow Stats Alternative Unemployment Rate chart, which includes short-term discouraged workers to the “U3” and “U6” unemployment numbers, the ‘real’ unemployment number exceeds 22%.
- Obama’s Great Recession. Evolution of Jobs Gap and into the Future. If the economy adds about 208,000 jobs per month, which was the average monthly rate for the best year of job creation in the 2000s, then it will take until February 2020—8 years—to close the jobs gap. Given a more optimistic rate of 321,000 jobs per month, which was the average monthly rate for the best year of job creation in the 1990s, the economy will reach pre-recession employment levels by April 2016—not for another four years. Let’s do the math. Obama’s economy added 115,000 jobs in April. May netted 69,000 new jobs.
- Percent of Job Losses in Post WWII Recessions. The chart. Just look at the red inky…
- Obama’s Sluggish Economy has Disproportionately affected Black Workers. Thirteen percent overall black unemployment. The failed economic policies of Obama are destroying the black community and lessening the chances for economic freedom while promoting economic dependence. Indeed, according to Rep. Maxine Waters (D-CA), one out of every six African Americans, male or female, are now unemployed. Yet, Obama leads percieved rival Romney by an enormous 94%-3% margin among black voters. I find it ironic the man who has given blacks their highest level of unemployment has rewarded him with his highest approval rating.
- Forbes: Obama is the Biggest Government Spender in World History. Fiscal year 2009 ran from October 1, 2008 until September 30, 2009. Obama’s term began on January 20, 2009. Recall, however, that in 2008 Congress was controlled by Democrat majorities. The budget approved and implemented by Pelosi, Obama and the rest of the Congressional Democrat majorities provided for a 17.9% increase in spending for fiscal 2009 alone!
- Federal Government Spending does not Create Jobs. In fact, it is exactly the opposite. More government spending is correlated with higher levels of unemployment. The chart – the more resources the government usurps from the private sector, the less job creation occurs.
- Runaway Spending Source of Deficit – Not Taxes. The chart. The main driver behind long-term deficits is spending – not low revenues. Historical from CBO data.
- National Debt has Increased More under Obama than Under Bush. Under Bush, the debt rose $4.899 trillion in eight years. In three years, Obama has exploded the debt by $4.939 trillion. In fact, the national debt now exceeds 100% of the nation’s GDP. To clear up any confusion between ‘debt’ and ‘deficit’, the deficit is the difference between how much the federal government spends and how much it collects in ‘one year’. The national debt, on the other hand, is the total amount we owe. One way to think about the national debt is as accumulated deficits. Our national debt is $15.75 Trillion. This creative video depicts the national debt as a road trip and visualizes how fast the most recent US Presidents have increased the debt.
- Obama 1st Term Spending up 24% vs. Bush’s Last Term, at Minimum. Ah, you see, here is the kicker; Obama is trying to pawn off FY 2009 on Bush spending. So even if you take all of the FY2009 outlays and blame it on Bush – which would include the second half of TARP that Obama requested; most of the Auto Bailout which Obama pushed; The Mortgage/Loan Medication Program; The Omnibus Spending Bill signed by Obama March 2009; The Stimulus Bill, and the S-CHIP expansion – take all of this and place it on Bush, spending is still up by almost 24% in Obama’s first term versus Bush’s last: Total outlays in the four Budget years ending and including FY2009 was $11.882 trillion dollars vs total spending of $14.645 trillion for Obama. These guys can sure tell whoppers without a blink of an eye.
- Obama’s Stimulus Model Failed. But why? The problem isn’t data going into Obama’s forecast model, the problem is the forecast model built on Keynesian assumptions about the impact of government spending and temporary tax hikes. Obama simply has the wrong model for growth. Whenever you have unpredictable economic policy — massive failed fiscal “stimulus” and ballooning debt, tax fears and threats, the Fed’s QE with multiyear near-zero interest rates, and regulatory uncertainty due to ObamaCare and Dodd-Frank financial reforms — the result will be persistent high unemployment and a feeble recovery. Liberals have constantly clambered the economy would have been worse without the stimulus. These charts and explanations prove that instead of producing an economic recovery, the stimulus produced only broken promises and massive debt. This economy will not rebound until it is unleashed from government oppression.
- Stunning Chart Shows Obama Spending Binge. And, watch WSJ Analyst Stephen Moore eviscerate Obama over his bogus spending claims in this Video.
- Under Obama: $1 Trillion Deficits each Year. Last Year; Actually $5 Trillion. Since 2009, and since Senate Democrats last passed a budget, the [CBO] has calculated $1 trillion deficits each year with 2012 being no exception. But now, a new USA Today study shows that last year’s budget deficit wasn’t $1 trillion….it was actually $5 trillion.
- Obama’s Budget Deficits, as a Percentage of GDP, is Unprecedented. The chart shows by Administration. Source: Office of Management and Budget. Watch this video dated February, 2009 as Obama opines about how he will cut the deficit in half during his first term. Epic Fail.
- CBO’s Wakeup Call Warns of Deeper U.S. Recession in 2013. Bloomberg Video. CBO: ‘heading toward an impending “fiscal cliff” January 1, 2013.
- The Food Stamp President. According to the Congressional Budget Office (CBO), every seventh person you pass on a sidewalk relies on food stamps. Under Obama’s tutelage, we’ve gone from 32M to 46M on food stamps. The raw data.
- Obama Green Jobs Cost $5 Million Each. But, but, but… Obama promised to create 5 million “green” jobs. He’s about 4,996,455 short.
- Fuel Prices skyrocket under Obama. On the last day of President Bush’s presidency, gas prices were $1.84 a gallon. Today under Obama, the average price of a gallon of gas costs $3.71. Since Obama took office, a gallon of gasoline has spiked 90%.
- Obama’s closure of Gulf of Mexico Offshore Drilling/Permitting Costly. According to the American Petroleum Institute, it has cost ‘thousands’ of American jobs, billions less in government revenues and an increasing dependence on foreign energy.”
- Inflation Surges under Obama. U.S. shoppers are reining in their household budgets as higher prices for food and fuel are hammering American consumers, and this time it really hurts.
- American business leaders know what’s wrong with the economy – Obama’s policies. MSNBC Video. Keep in mind, Jim Cramer is a Democrat and is an Obama supporter.
- Business Leaders Fear ObamaCare. Video – MSNBC: Jim Cramer: “Business Leaders tell me ‘ObamaCare’ is going to derail the economy.”
- The Housing Crisis has now Destroyed $7 trillion in U.S. Household Wealth. More than one in four U.S. homeowners are “under water” or owe more than their homes are worth. Another 9.5 million homes are still at risk of default.
- Sure. Let’s talk Fair Share. The chart shows the share of individual income tax burden versus share of income for wage earners making over $75,0000.
- Top 10% of Wage Earners Pay 70% of Taxes. Obviously, Democrats want the 1% to pay “their fair share” meaning 100% of the tax load? Should we also mention that the U.S. has dubious distinction of having the highest corporate income tax rate in the world?
- Real Median Household Income Under Obama Down. Per Bloomberg, down $4300 since Obama took office. Oh, and Obama’s Recession has lost 129,000 Millionaires in 2011…
- Barack Obama’s Budget Defeated. No Leadership; 414-0 in the House and 99-0 in the Senate.
- America Loses its AAA Credit Rating Under Obama. The USA lost its AAA credit rating (which it had held since 1917) on Obama’s watch despite the fact that Timothy Geithner publicly said there was “no risk” of that happening.
- Census: U.S. Poverty Rate Swells to nearly 1 in 6. Over 46 million now living in poverty; the largest on record dating back to when the census began tracking poverty in 1959.
- Americans are Growing more Pessimistic about the Economy and Obama. And the gloomier outlook extends across party lines, including a steep decline in the share of Democrats who call the economy “good,” down from 48% in February to just 31% now. Almost two-thirds of Americans — 65% — disapprove of Obama’s handling of gas prices alone. And, two June Gallup polls are showing cracks in Obama’s 2008 base: union members; blacks and white subgroups, while overall voter sentiment is tilting Republican. Obama’s approval rating from Independents has sunk to 35% mid-June.
- Obama’s Entire Reelection Problem in One Chart. Obama is below the reelection Mendoza line. Weak growth equals weak incomes equals a one-termer. Real Per Capita Disposable Income is the best predictor of Presidents getting reelected. Lets hope the predictive model for Barky is true. I kinda like this chart.
Conclusion
There is no silver lining to Obama’s economic policies. This entire deteriorating economic outlook has undermined business confidence. Fear of implementation of ObamaCare. New EPA rulings. Ban on oil drilling. Spiraling debt. Real Estate Foreclosures. Bank failures. Increase in oil and energy prices. Falling dollar. Higher inflation. Taxing the 1%… Consumer confidence is down. All of this has paralyzed economic recovery as business leaders hold off on ‘new investments’ and corporate leaders ‘wait and see’ what next mandate is handed down from Washington.
The Obama administration can report all the funny numbers it wants, but the American people know in their guts that things are getting much worse. Its fabricated optics. Just about every objective indicator foreshadows a re-election defeat for Obama. He has spent his term in the White House trying to tax, spend and regulate the nation into prosperity. Obamanomics, Keynesian economics on steroids, has been a legacy of failure. You can’t put a happy face on the unemployment rate figures when people are not working. The USA has had the longest streak of +8% unemployment since the Depression under Obama: 39 months and counting.
Do not believe what the Obama government says, especially, with the unemployment and economic statistics. Trust your instincts. The ‘False Narrative’ is a boom industry in an election year. Manufactured government statistics will try to get Obama re-elected. Its twisted logic to think a President can benefit from a flawed formula that generates a positive outcome as unemployment numbers rise. Too many of us get swayed with unrelated distractions. Get comfortable talking about the facts of Obama’s failed economy. Its all right here.
Any Republican who doesn’t soundly tar and feather Obama with the job numbers this campaign is not worth his salt. Polls and government figures are equal to fairy tales. This ‘Great Obama Recession” will not be televised. It is up to us to spread the word. Even Arianna Huffington isn’t believing Obama’s jobs rhetoric anymore. Cue the golf clap.
Remember, Obama is claiming the US economy has improved since his inauguration and that the ‘private sector’ is doing fine.. Are you better off than you were four years ago?” Uh, no… Democrats should seek wisdom from their own if they are serious about winning in November. If I wanted America to Fail.. Video.
Additional Resources:
A List of “Firsts” for President Obama
Obama’s List of ‘Accomplishments’
Federal Budget in Pictures – Taxes
Federal Budget in Pictures – Federal Spending
Federal Budget in Pictures – Debt & Deficits
Federal Budget in Pictures – Entitlements
Bureau of Labor Statistics – BLS
Heritage: Bush Taxes & Deficit Myth
Heritage: Ten Myths About the Bush Tax Cuts
Heritage: Three Top Tax Cuts and Deficit Myths
Heritage: Bush Tax Cuts did not Cause Budget Deficit
Heritage: Tax Rate Reductions vs Rebates
Heritage: Top 10 Myths about Bush Tax Cuts
Heritage: Tax Cut Myths & realities
Heritage: Tax Cuts increase Federal Revenues
Factcheck.org – Bush Middle Class Tax Breaks


Reblogged this on Freedom Is Just Another Word….
Reblogged this on Talon's Point.
Reblogged this on Gds44's Blog.
Reblogged this on Leftoutinamerica's Blog.
Reblogged this on The Right of the People and commented:
This article is full of win. It nails every issue solidly. GOP, please focus on the economy and Obama’s track record with it.